








Trend Statistics
Recent readings, station records, and wind data - refreshed automatically every 5 minutes
Current Trends Updated Every 5 Minutes - Last Update: 13/11/2026 at 20:15
| TIME | TEMP °C |
WIND SPEED mph |
WIND GUST mph |
WIND DIR |
HUMIDITY % |
PRESSURE mb |
RAIN mm |
| Current | 1.6 | 0.0 | 0.0 | NE | 93 | 1020.0 | 0.0 |
| 5 minutes ago | 1.6 | 0.0 | 0.0 | NE | 92 | 1020.0 | 0.0 |
| 10 minutes ago | 1.6 | 0.0 | 0.0 | NE | 92 | 1020.0 | 0.0 |
| 15 minutes ago | 1.6 | 0.0 | 0.0 | NE | 92 | 1020.0 | 0.0 |
| 20 minutes ago | 1.7 | 0.0 | 0.0 | NE | 92 | 1020.0 | 0.0 |
| 30 minutes ago | 1.8 | 0.0 | 0.0 | NE | 91 | 1020.0 | 0.0 |
| 45 minutes ago | 2.0 | 0.0 | 0.0 | NE | 90 | 1019.0 | 0.0 |
| 60 minutes ago | 2.1 | 0.0 | 0.0 | NE | 90 | 1020.0 | 0.0 |
| 75 minutes ago | 2.3 | 0.0 | 0.0 | NE | 89 | 1019.0 | 0.0 |
| 90 minutes ago | 2.4 | 0.0 | 0.0 | NE | 88 | 1019.0 | 0.0 |
| 105 minutes ago | 2.7 | 0.0 | 0.0 | NE | 88 | 1019.0 | 0.0 |
| 120 minutes ago | 2.7 | 0.0 | 0.0 | NE | 88 | 1019.0 | 0.0 |
Records and Stats
| RAIN | RAIN HISTORY | ||
| Today | 0.0 mm (0.0 mm last hour) | Today | 1 day(s) since last rain on 11/11/2026 09:57 |
| Yest. | 0.0 mm | Week | 24.4 mm over last 7 days. |
| Month | 24.7 mm (5 rain day(s) this month) | Month | 15.7 mm last month. |
| Year | 730.6 mm (134 rain day(s) this year) | Year | 614.9 mm total last year at this time. |
| TEMPERATURE HIGHS | HOT DAYS THIS MONTH | ||
| Today | 8.7 °C at 13:01 | Max > 25 °C | 0 day(s) |
| Yest. | 8.5 °C at 12:53 | Max > 20 °C | 0 day(s) |
| Month | 13.9 °C on 07/11/2026 | Warmest day | 10.6 °C on 06/11/2026 |
| Year | 35.5 °C on 25/06/2026 | Warmest night | 8.1 °C on 07/11/2026 |
| TEMPERATURE LOWS | COLD DAYS THIS MONTH | ||
| Today | -0.8 °C at 06:46 | Min < 5 °C | 6 day(s) |
| Yest. | 1.3 °C at 23:24 | Min < 0 °C | 1 day(s) |
| Month | -0.8 °C on 13/11/2026 | Coldest day | 3.9 °C on 13/11/2026 |
| Year | -5.3 °C on 06/01/2026 | Coldest night | 1.5 °C on 13/11/2026 |
| BAROMETER HIGHS | WIND CHILL LOWS | ||
| Today | 1020.0 mb at 19:08 | Today | -0.8 °C at 06:46 |
| Yest. | 1014.0 mb at 23:53 | Yest. | -0.4 °C at 23:44 |
| Month | 1037.0 mb on 02/11/2026 | Month | -0.8 °C on 13/11/2026 |
| Year | 1037.0 mb on 02/11/2026 | Year | -6.7 °C on 04/01/2026 |
Wind Data
| CURRENT | 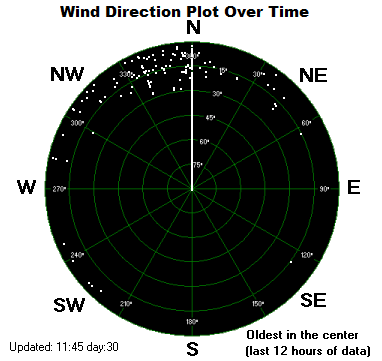 |
|
| Now | 0.0 mph NE | |
| Gust | 0.0 mph NE | |
| Gust/hr | 0.0 mph | |
| WIND GUST HIGHS | ||
| Today | 6.1 mph NE at 13:01 | |
| Yest. | 14.8 mph at 11:15 | |
| Month | 15.0 mph on 12/11/2026 | |
| Year | 39.6 mph on 12/03/2026 | |
| WIND GUST AVERAGE HIGHS | ||
| Today | 3.2 mph NE at 13:01 | |
| Yest. | 6.6 mph at 11:40 | |
| Month | 7.1 mph on 04/11/2026 | |
| Year | 14.7 mph on 12/03/2026 | |
| WIND RUN | ||
| Today | 0.54 miles | |
| Month | 96.45 miles | |
| Year | 11966.87 miles | |
About these trends
Trends show whether a reading is rising, falling or steady over recent hours, which is often more useful than the number itself. A steadily falling barometer usually means wind and rain are on the way, while a steadily rising one points to settling, drier weather. Temperature and humidity trends show how quickly conditions are changing through the day.
All trends are calculated from our own weather station's readings.