








Southampton Air Quality
Data from Open-Meteo Air Quality API • Last checked: 23:46 on Wednesday 28 October 2026
Current Pollutant Readings
| Pollutant | Reading | Units | DAQI | Band |
|---|---|---|---|---|
| PM10 Particles | 15.1 | µg/m³ | 1 | Low |
| PM2.5 Particles | 8.3 | µg/m³ | — | — |
| Nitrogen Dioxide | 14.1 | µg/m³ | 1 | Low |
| Ozone | 42.0 | µg/m³ | 2 | Low |
| Sulphur Dioxide | 1.0 | µg/m³ | 1 | Low |
| Carbon Monoxide | 0.172 | mg/m³ | 1 | Low |
PM2.5 is shown for reference; it is not part of the UK DAQI calculation. Readings are hourly spot values from the Open-Meteo forecast model.
5-Day Air Quality Outlook
| Wed 28 Oct | Thu 29 Oct | Fri 30 Oct | Sat 31 Oct | Sun 1 Nov |
|---|---|---|---|---|
|
3
Low
avg 2.3
|
3
Low
avg 1.8
|
2
Low
avg 2
|
2
Low
avg 2
|
2
Low
avg 1.8
|
Southampton City Centre — DEFRA Roadside Monitor
|
This air monitoring station is within a self-contained, air-conditioned housing located at the junction of a residential road and a six-lane dual carriageway between Northam and the city centre. Traffic flow is approximately 25,000 vehicles per day, subject to periodic congestion during peak periods. The manifold inlet is approximately 10 metres from the residential road kerbside at a height of approximately 3 metres. The surrounding area is predominantly urban residential.
Site address: Brintons Road / Northam Road, Southampton, Hampshire |
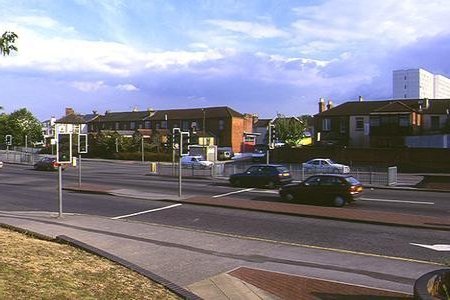 Brintons Road / Northam Road monitoring station |
Realtime Air Quality Graphs — Past 7 Days (Station SA33)

About the UK Daily Air Quality Index
In the UK, most air pollution information services use the index and banding system approved by the Committee on Medical Effects of Air Pollution Episodes. The system uses a 1–10 index divided into four bands, similar to the UV or pollen index.
| Band | Index | Health advice for sensitive individuals |
|---|---|---|
| Low | 1, 2 or 3 | Effects are unlikely to be noticed even by individuals who know they are sensitive to air pollutants. |
| Moderate | 4, 5 or 6 | Mild effects, unlikely to require action, may be noticed amongst sensitive individuals. |
| High | 7, 8 or 9 | Significant effects may be noticed by sensitive individuals and action may be needed (e.g. reducing time in polluted areas outdoors). Asthmatics will find their ‘reliever’ inhaler is likely to reverse effects on the lung. |
| Very High | 10 | The effects on sensitive individuals described for High levels of pollution may worsen. |
Air pollution can cause short-term health effects to sensitive individuals (people with heart disease or lung conditions, including asthma). Effects can be reduced by spending less time outdoors in polluted areas. ‘Reliever’ inhalers should lessen effects on asthma sufferers.
A Guide to UK Air Pollution Information Resources (DEFRA PDF)
Index Boundaries for Each Pollutant
| Band | Index | Ozone (µg/m³) 8h or 1h mean |
NO2 (µg/m³) 1h mean |
SO2 (µg/m³) 15min mean |
CO 8h mean |
PM10 (µg/m³) 24h mean |
|||||
|---|---|---|---|---|---|---|---|---|---|---|---|
| µg/m³ | ppb | µg/m³ | ppb | µg/m³ | ppb | mg/m³ | ppm | Grav. | Ref. | ||
| Low | 1 | 0–33 | 0–16 | 0–95 | 0–49 | 0–88 | 0–32 | 0–3.8 | 0.0–3.2 | 0–21 | 0–19 |
| 2 | 34–65 | 17–32 | 96–190 | 50–99 | 89–176 | 33–66 | 3.9–7.6 | 3.3–6.6 | 22–42 | 20–40 | |
| 3 | 66–99 | 33–49 | 191–286 | 100–149 | 177–265 | 67–99 | 7.7–11.5 | 6.7–9.9 | 43–64 | 41–62 | |
| Moderate | 4 | 100–125 | 50–62 | 287–381 | 150–199 | 266–354 | 100–132 | 11.6–13.4 | 10.0–11.5 | 65–74 | 63–72 |
| 5 | 126–153 | 63–76 | 382–477 | 200–249 | 355–442 | 133–166 | 13.5–15.4 | 11.6–13.2 | 75–86 | 73–84 | |
| 6 | 154–179 | 77–89 | 478–572 | 250–299 | 443–531 | 167–199 | 15.5–17.3 | 13.3–14.9 | 87–96 | 85–94 | |
| High | 7 | 180–239 | 90–119 | 573–635 | 300–332 | 532–708 | 200–266 | 17.4–19.2 | 15.0–16.5 | 97–107 | 95–105 |
| 8 | 240–299 | 120–149 | 636–700 | 333–366 | 709–886 | 267–332 | 19.3–21.2 | 16.6–18.2 | 108–118 | 106–116 | |
| 9 | 300–359 | 150–179 | 701–763 | 367–399 | 887–1063 | 333–399 | 21.3–23.1 | 18.3–19.9 | 119–129 | 117–127 | |
| Very High | 10 | ≥360 | ≥180 | ≥764 | ≥400 | ≥1064 | ≥400 | ≥23.2 | ≥20 | ≥130 | ≥128 |
* For ozone, the maximum of the 8-hourly and hourly mean is used to calculate the index value.
Banding system © 2012 The UK Department for Environment, Food & Rural Affairs.
Forecast data: Open-Meteo (CC BY 4.0) • Realtime monitoring: DEFRA UK-Air station SA33